Tech Stack
React
Typescript
Tailwind CSS
Node.js
PostgreSQL
Description
DevPulse ingests webhooks from GitHub, CI pipelines, and the deploy system into a normalized event store, then rolls them up into DORA metrics (lead time, deploy frequency, change failure rate, MTTR) per team.
The frontend focuses on making the numbers actionable: cycle-time distributions instead of averages, annotated trend lines, and alerting when a metric regresses beyond a configured threshold.
- Adopted by 12 engineering teams as the default sprint-health dashboard.
- Cut PR cycle-time reporting from a weekly manual spreadsheet to live, always-current charts.
- Designed an incremental rollup pipeline processing ~50k events/day on a single Postgres instance.
- Built configurable regression alerts that flagged two real deploy-pipeline slowdowns in the first month.
Page Info
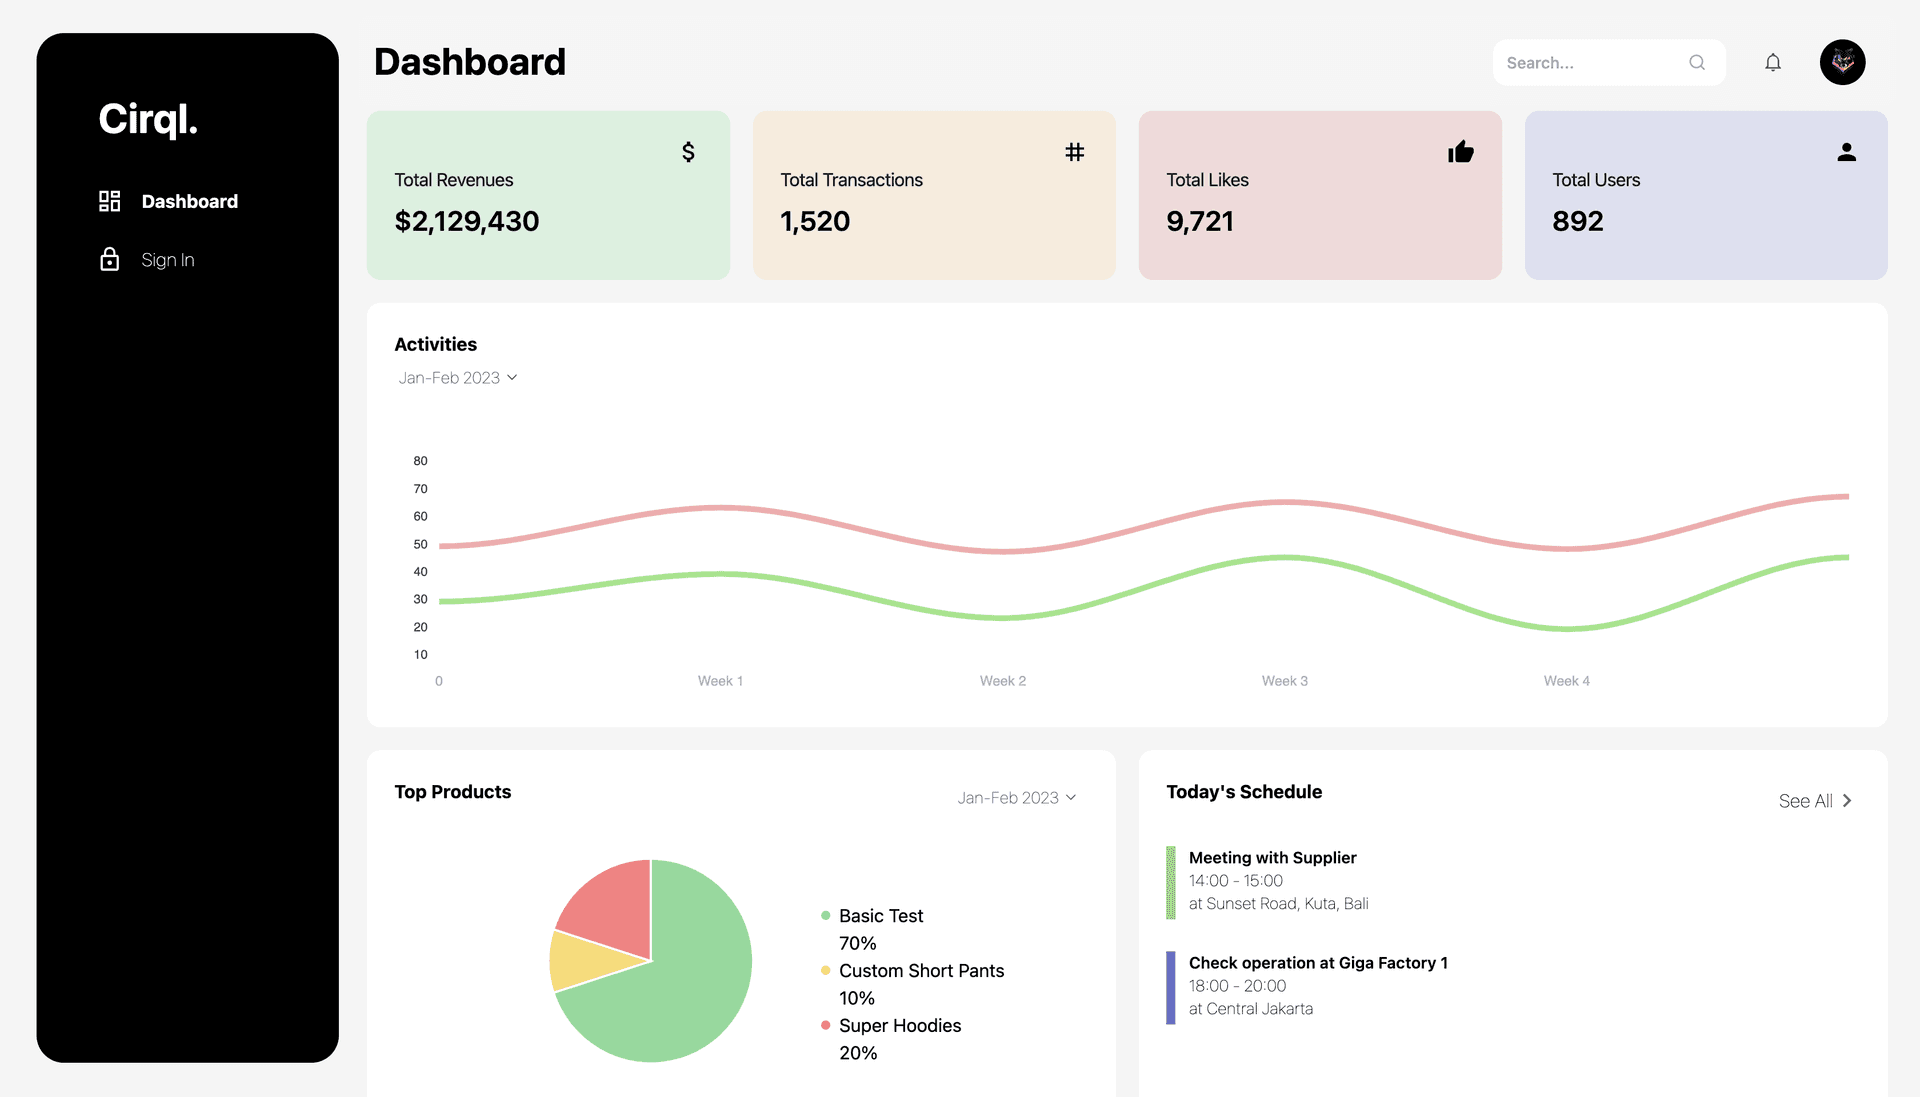
Metrics Overview
Team dashboard with DORA metrics, PR cycle-time distributions, and deploy frequency trends.

Team & Settings Views
Per-team drill-downs, repo configuration, and alert thresholds.